Plot evolution of thresholds during test
Here we compute and plot the evolution of the multipactor thresholds during the conditioning process.
Set up
[1]:
from multipac_testbench import MultipactorTest
from multipac_testbench.data import config_path
from multipac_testbench.data.multipactor_tests import test_140MHz_SWR3_12
from multipac_testbench.instruments import CurrentProbe, FieldProbe, ForwardPower

multipactor_test =  MultipactorTest(test_140MHz_SWR3_12, config_path, freq_mhz=140.0, swr=3.0, is_raw=True)
ERROR:root:column_header = 'NI9205_E1' not present in provided file. Skipping associated instrument.
Compute local multipactor thresholds
Load some utils
[2]:
from functools import partial
from multipac_testbench.util.multipactor_detectors import quantity_is_above_threshold
Define multipactor criterions:
Current should be above 12uA
It should appear on at least 1 consecutive points
[3]:
current_multipactor_criterions = {'threshold': 12., 'minimum_number_of_points': 1}
current_multipac_detector = partial(quantity_is_above_threshold, **current_multipactor_criterions)
The thresholds are stored in a ThresholdSet object.
[4]:
thresholds = multipactor_test.determine_thresholds(current_multipac_detector, CurrentProbe)
WARNING:root:User should manually trim exceedent powers in order to avoid flat minima at the end of the test.
WARNING:root:Multiple instruments detected at the same position 0.611:
- NI9205_MP4l
- NI9205_MP8l
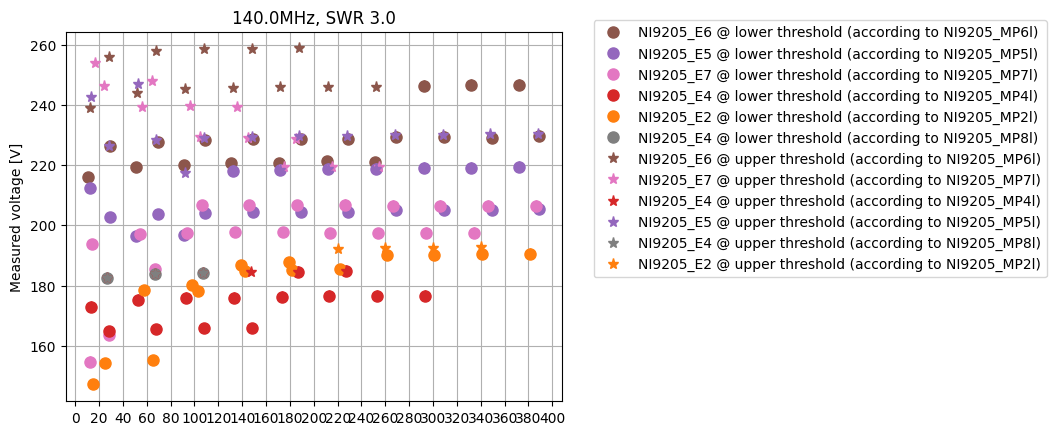
Plot evolution of local voltage thresholds during conditioning
Here, we have as much multipactor thresholds as we have current probes which detected it. We plot local thresholds:
[5]:
axes, _ = multipactor_test.plot_thresholds(FieldProbe, thresholds, figsize=(8, 8))
axes.legend(loc='upper left', bbox_to_anchor=(1.05, 1.05))
[5]:
<matplotlib.legend.Legend at 0x7effad3974d0>
Merge local thresholds into a global
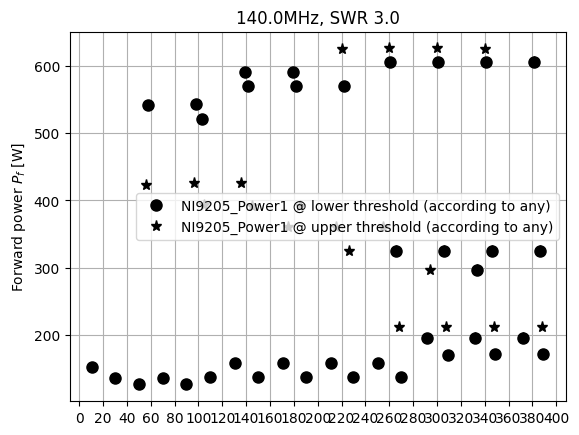
If we want a more global approach, eg to define thresholds as power thresholds, we need to merge the previous thresholds. Here, the merged object will determine when there is multipactor, anywhere in the line.
[6]:
merged = multipactor_test.determine_thresholds(
    current_multipac_detector,
    CurrentProbe,
    threshold_reducer = "any", # There is multipactor when a multipactor event is detected anywhere in the line
)
WARNING:root:User should manually trim exceedent powers in order to avoid flat minima at the end of the test.
Plot evolution of global power thresholds during the test
[7]:
axes, _ = multipactor_test.plot_thresholds(ForwardPower, merged, figsize=(8, 8), global_multipactor=True)