MULTIPAC test bench

Contents:

  • Introduction
  • Configuration
  • Load files
  • Gallery
    • Plot signal measured by instruments
    • Plot an instrument signal vs another
    • Plot data from several tests on same fig
    • Plot evolution of thresholds
    • Plot voltage thresholds (local)
    • Make a susceptiblity chart
    • Check Somersalo scaling law
    • Reconstruct electric field at every position
    • Animate the test
  • Tutorials
  • Bibliography
  • API Reference
MULTIPAC test bench
  • Gallery
  • View page source

Gallery

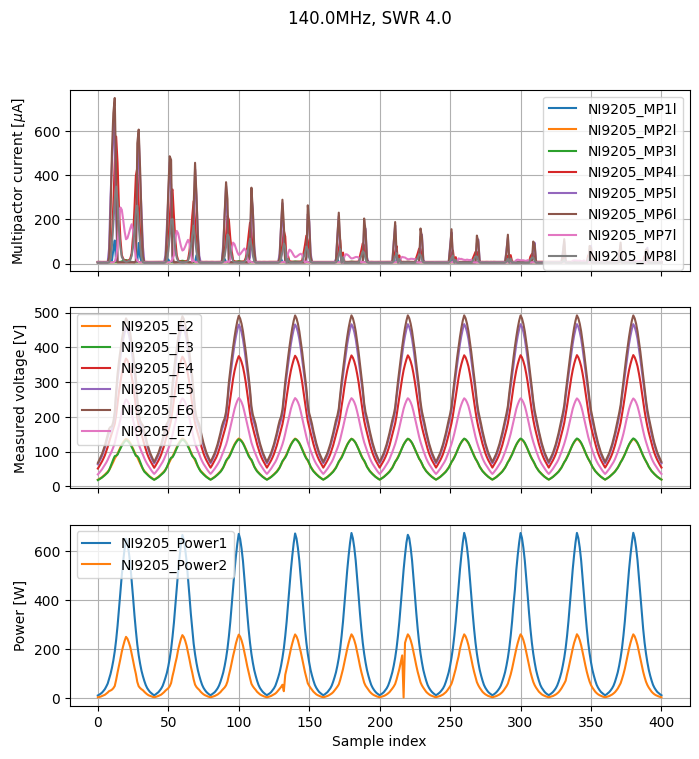
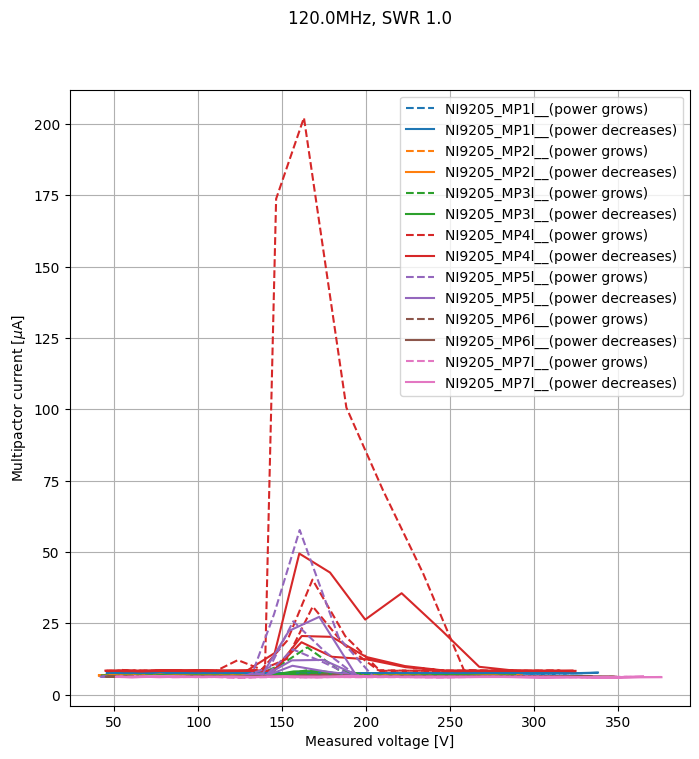
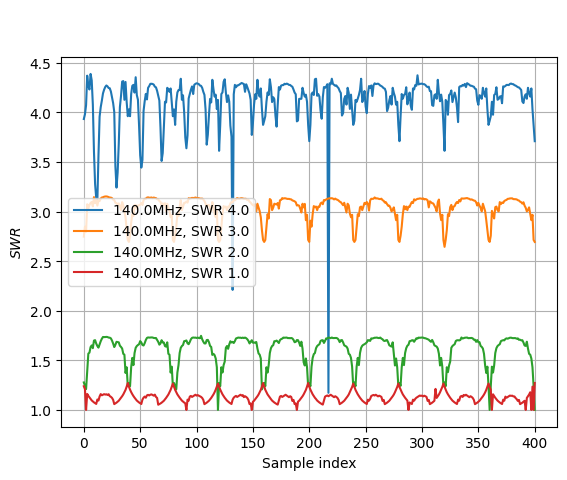
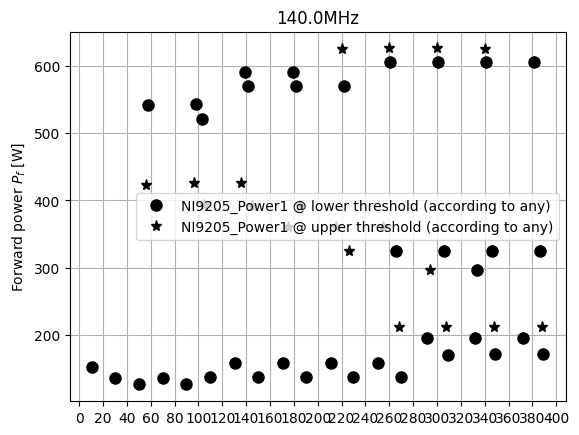
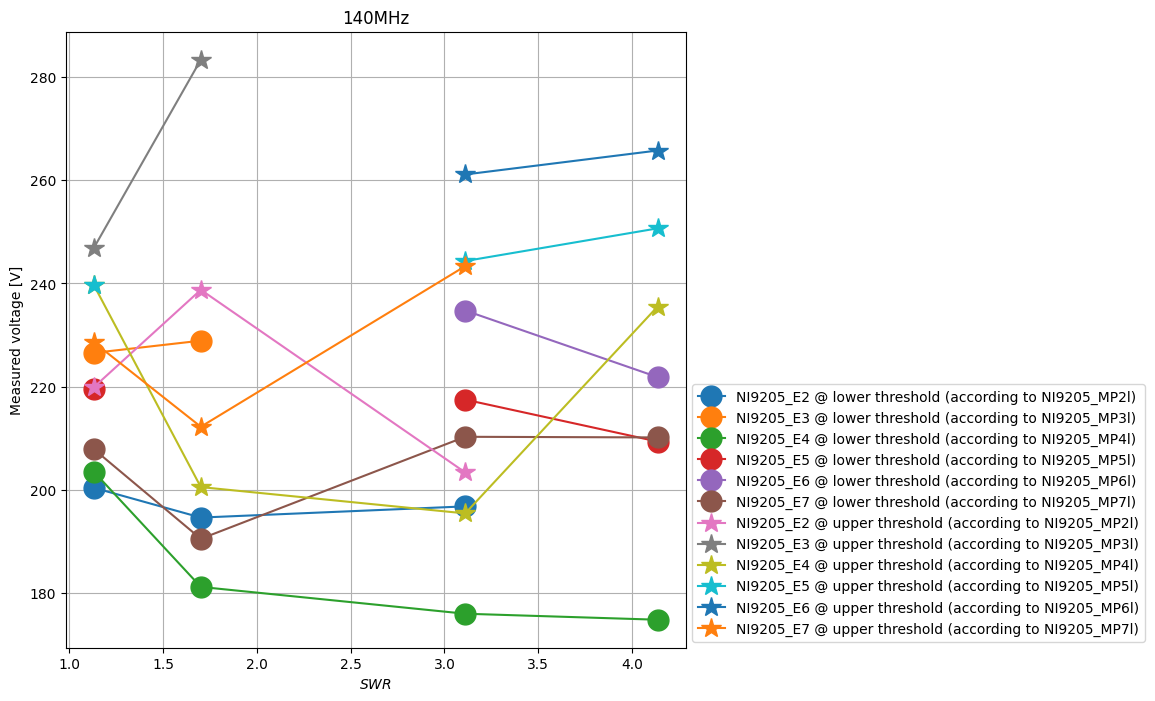
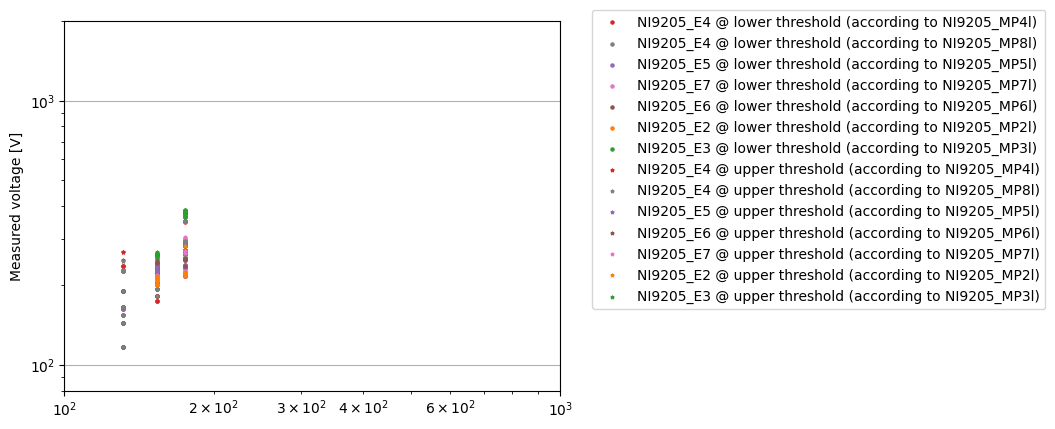
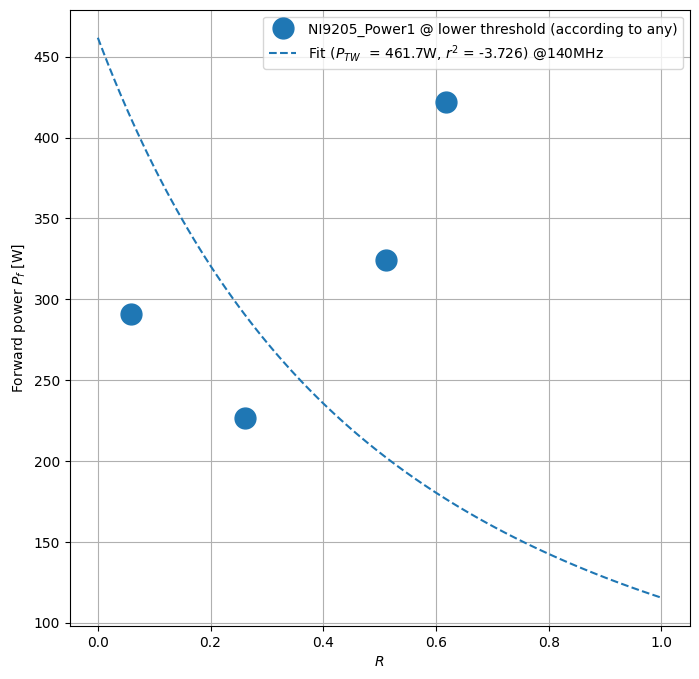
Here you will find some examples of plots that can be produced, as well as the Jupyter Notebooks to produce it. For more details, check out the Tutorials section.

Plot signal measured by instruments
Plot an instrument signal vs another
Plot data from several tests on same fig
Plot evolution of thresholds
Plot voltage thresholds (local)
Make a susceptiblity chart
Check Somersalo scaling law
Reconstruct electric field at every position
Animate the test
Previous Next

© Copyright 2026, Adrien Plaçais.

Built with Sphinx using a theme provided by Read the Docs.