Plot an instrument data vs another
In some cases, it may be interesting to plot the signal of an instrument vs the signal of another, rather than plotting the signals vs time.
Load data
[1]:
from multipac_testbench import MultipactorTest
from multipac_testbench.data import config_path
from multipac_testbench.data.multipactor_tests import test_120MHz_SWR1_4
import multipac_testbench.instruments as ins

multipactor_test =  MultipactorTest(test_120MHz_SWR1_4, config_path, freq_mhz=120.0, swr=1.0, trigger_policy="average", is_raw=True)
Here we want to have the FieldProbe on x-axis, and current measured at same position, same time steps.
We exclude one instrument:
- The current probe at E8, because there is no corresponding FieldProbe.
[4]:
exclude = "NI9205_MP8l"
x_instrument = ins.FieldProbe
y_instrument = ins.CurrentProbe
figsize = (8, 8)
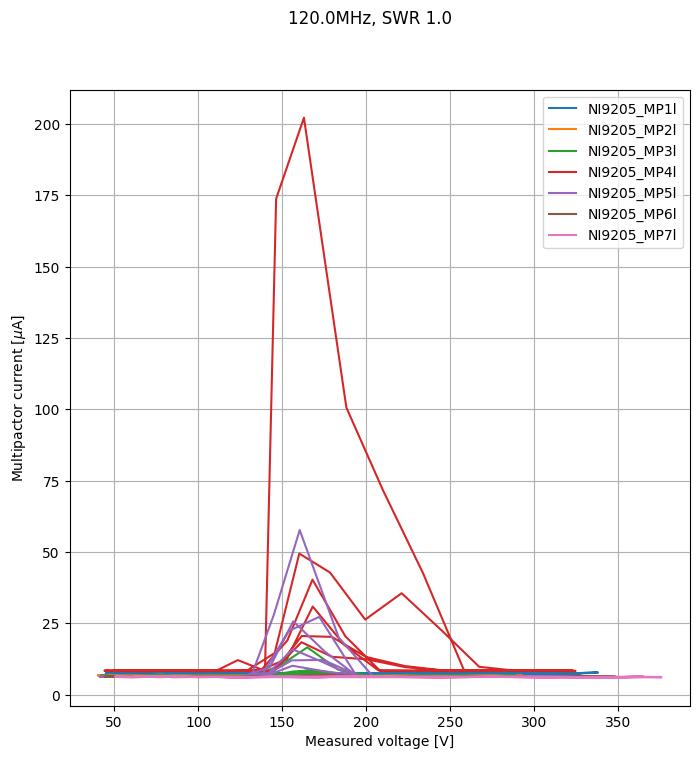
Plot current versus electric field
[5]:
_, _ = multipactor_test.sweet_plot(
    y_instrument,
    xdata=x_instrument,
    exclude=exclude,
    figsize=figsize,
)
Some plotting options
It is possible to take only the tail last points:
[7]:
tail = 400  # this is approximatively the two last half-power cycles
_, _ = multipactor_test.sweet_plot(
    y_instrument,
    xdata=x_instrument,
    exclude=exclude,
    figsize=figsize,
    tail=tail,
)

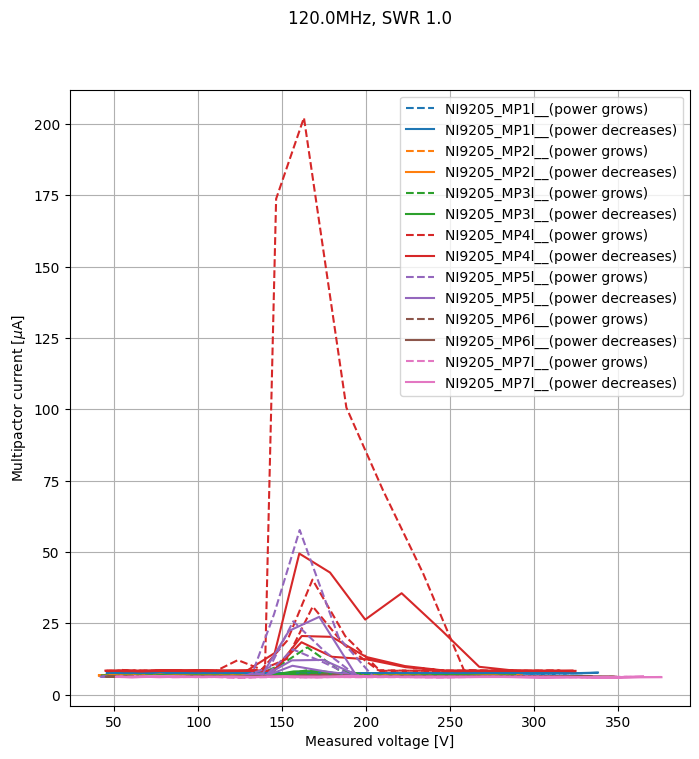
In this example, we can make great use of the masks optional keyword for MultipactorTest.sweet_plot() method.
We will use it to outline whether forward power grows or decreases.
First, we determine when power grows with the ForwardPower.growth_mask() method (check documentation for an explanation of the arguments).
[8]:
power = multipactor_test.get_instrument(ins.ForwardPower)
growth_mask = power.growth_mask(minimum_number_of_points=10, n_trailing_points_to_check=5)
decrease_mask = ~growth_mask
WARNING:root:There was 5 'True' points in the last 5 points of the ForwardPower array. Setting it to False.
Now we create the masks dictionary; remember that keys of this dictionary should start with a double underscore __.
[9]:
masks = {
    "__(power grows)": growth_mask,
    "__(power decreases)": decrease_mask,
}
[10]:
_, _ = multipactor_test.sweet_plot(
    y_instrument,
    xdata=x_instrument,
    exclude=exclude,
    figsize=figsize,
    tail=tail,
    masks=masks,
)