Plot data from several tests on the same Figure
We show how results from several MultipactorTest can be gathered in a single TestCampaign for easier studies.
Set up
[1]:
from multipac_testbench import TestCampaign
from multipac_testbench.data import config_path
from multipac_testbench.data.multipactor_tests import tests_140
import multipac_testbench.instruments as ins

freqs = (140.0, 140.0, 140.0, 140.0)
swrs = (4.0, 3.0, 2.0, 1.0)

test_campaign =  TestCampaign.from_filepaths(
    tests_140,
    freqs,
    swrs,
    config_path,
    is_raw=True
)
[INFO    ] [loader.py           ] Applied trigger_policy = 'keep_all' on /home/placais/Documents/simulation/python/multipac_testbench/src/multipac_testbench/data/multipactor_tests/2025.06.20_140MHz-SWR4-11.csv
[ERROR   ] [factory.py          ] column_header = 'NI9205_E1' not present in provided file. Skipping associated instrument.
[INFO    ] [loader.py           ] Applied trigger_policy = 'keep_all' on /home/placais/Documents/simulation/python/multipac_testbench/src/multipac_testbench/data/multipactor_tests/2025.06.20_140MHz-SWR3-12.csv
[ERROR   ] [factory.py          ] column_header = 'NI9205_E1' not present in provided file. Skipping associated instrument.
[INFO    ] [loader.py           ] Applied trigger_policy = 'keep_all' on /home/placais/Documents/simulation/python/multipac_testbench/src/multipac_testbench/data/multipactor_tests/2025.06.20_140MHz-SWR2-13.csv
[ERROR   ] [factory.py          ] column_header = 'NI9205_E1' not present in provided file. Skipping associated instrument.
[INFO    ] [loader.py           ] Applied trigger_policy = 'keep_all' on /home/placais/Documents/simulation/python/multipac_testbench/src/multipac_testbench/data/multipactor_tests/2025.06.20_140MHz-SWR1-14.csv
[ERROR   ] [factory.py          ] column_header = 'NI9205_E1' not present in provided file. Skipping associated instrument.
Generic libraries:
[2]:
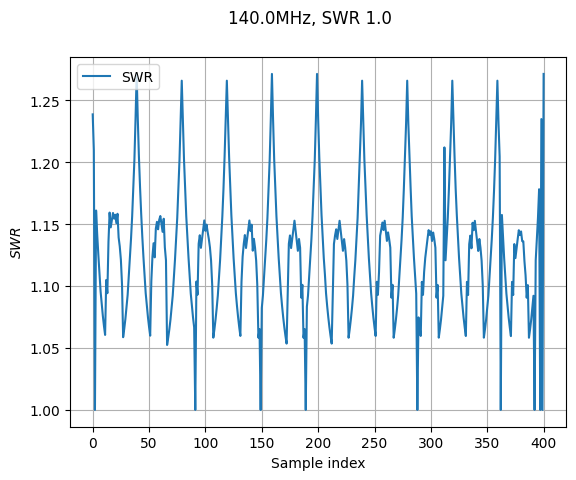
to_plot = ins.SWR
figsize = (8, 8)
Plot signals from all tests on different or same figure
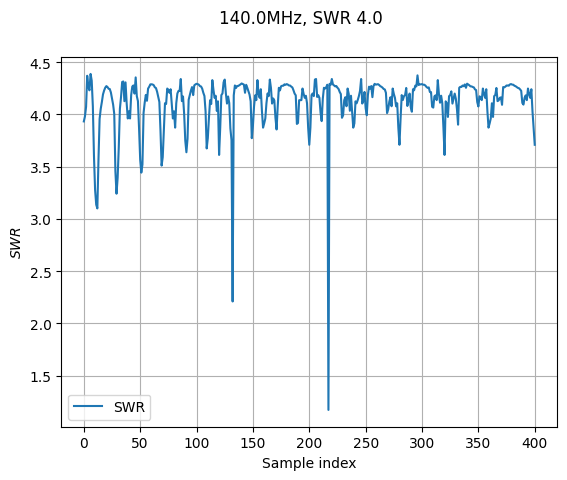
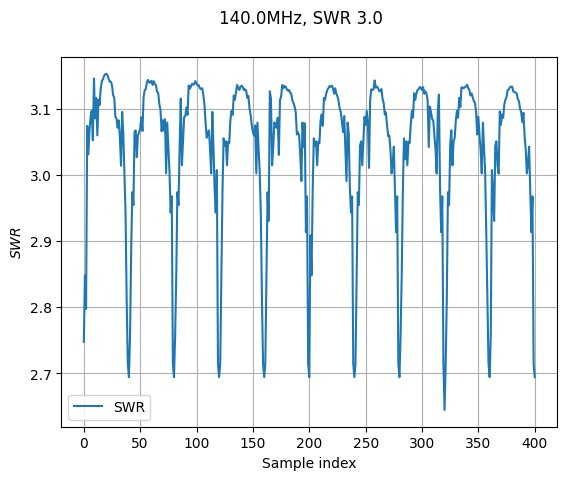
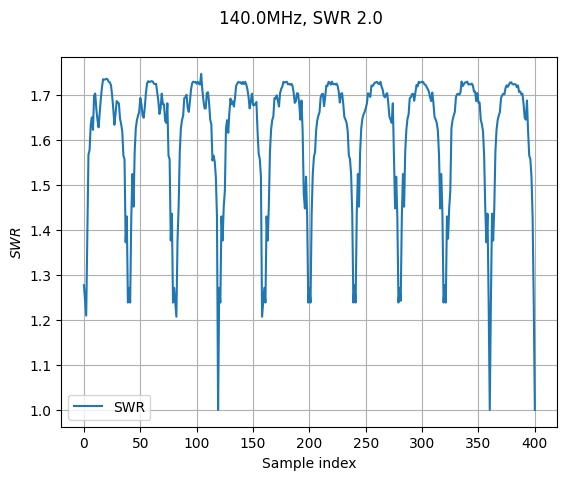
By default, every MultipactorTest data will be plotted in a separated Figure:
[3]:
_, _ = test_campaign.sweet_plot(to_plot)
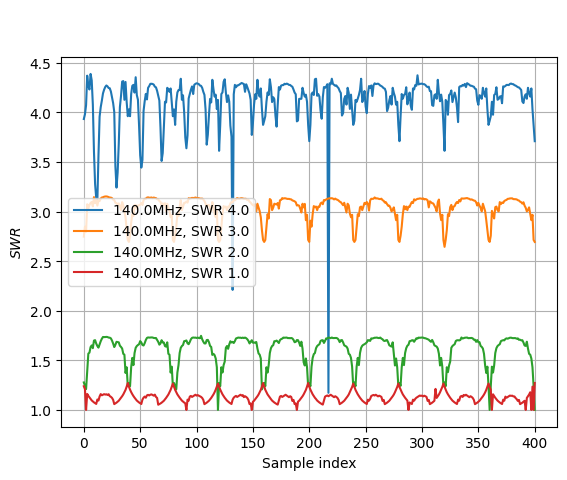
You can merge them by adding the all_on_same_plot=True keyword. Note that the behavior with plotting several instruments is untested.
[4]:
_, _ = test_campaign.sweet_plot(to_plot, all_on_same_plot=True)
[INFO    ] [multipactor_test.py ] Instrument.color attribute will not be used.
[INFO    ] [multipactor_test.py ] Instrument.color attribute will not be used.
[INFO    ] [multipactor_test.py ] Instrument.color attribute will not be used.
[INFO    ] [multipactor_test.py ] Instrument.color attribute will not be used.